The pulses generated by the detector-amplifier unit need to be registered and stored. To achieve this, I tested whether it is possible using an Arduino Nano. The pulses are applied to an analog input, which is continuously polled in a loop to check if a predefined threshold is exceeded. If so, the event is interpreted as a pulse and counted. The pulses have an amplitude of 0.2 to 2 V with amplifier variant 1 using bipolar transistors, and 0.1 to 0.5 V with amplifier variant 2 using operational amplifiers; these values can be processed by the Arduino’s ADC. The challenge is the pulse duration of approximately 100μs. In my experiments, this resulted in not all pulses being counted. The likely cause is that the clock speed of the Arduino in its standard configuration is too slow.
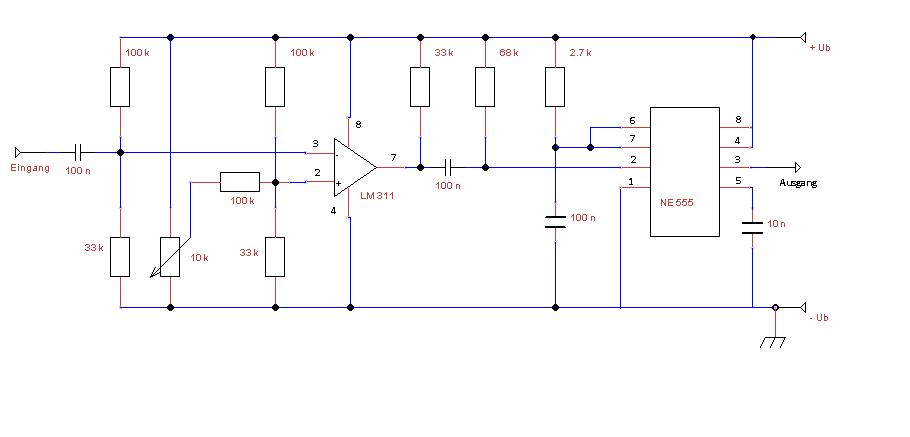
Therefore, the pulses generated by the amplifier are further converted into square pulses with a 300μs pulse length using a combination of a comparator and a monostable multivibrator. By adjusting the trigger threshold, smaller pulses that are not generated by alpha particles (such as noise or pulses from beta or gamma radiation) can be discriminated. The square pulses have an amplitude equal to the supply voltage Ub. However, the ADC of the Arduino is designed for voltages ranging from 0 to 5V, so a voltage divider must be used. In my setup with pulse shaping, I reduced the square pulse amplitude to approximately 2V. The circuit complexity for pulse shaping is minimal (see schematic below).
For convenient measurement, I use the following additional accessories:
- SD card for storing measurement data
- 2-line LCD display for showing measurement values
- RTC module for incorporating real-time data into the output
All modules are available at a low cost as Arduino accessories. The necessary libraries are either readily available online or included with the standard installation of the Arduino software.
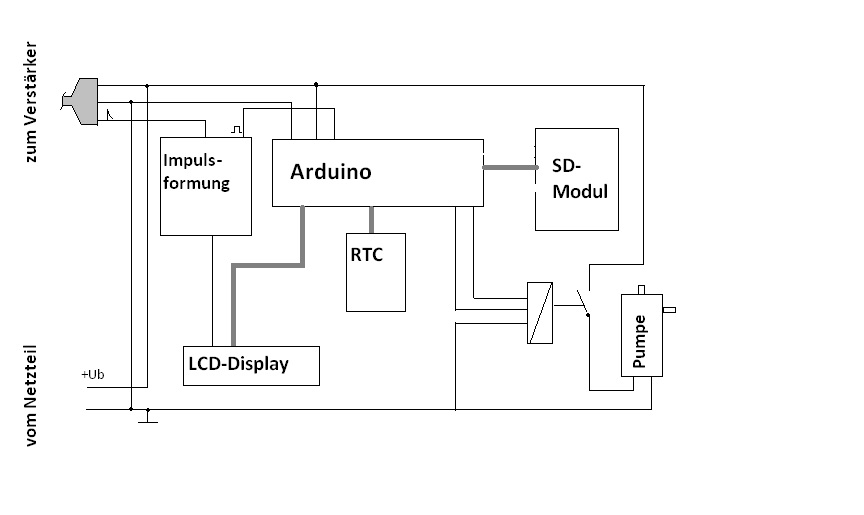
For measurements of thoron progeny, the required pump must be controlled via a relay with a timer. For measurements of radon progeny only, the relay is not needed.
A 2-line LCD module was used for direct display of measurement results. The first line shows the calculated result for the measurement variable EEC after the counting period, while the second line displays the accumulated pulses during that counting period. The EEC value is calculated using the equation described on the ‘Measurement Basics’ page, with a calibration factor predefined in the program (the determination of the calibration factor is explained later on the ‘Analysis’ page). The pulse count is updated every 10 seconds.
Figure: LCD display for measurement value and pulse count

Figure: Block diagram of the evaluation electronics setup

In my setup, I integrated the potentiometer for adjusting the contrast of the LCD display onto the pulse shaping circuit board; hence the thin connection between the LCD and pulse shaping modules. The pin assignments for the Arduino inputs and outputs used for the LCD display, SD card module, and RTC are described further below.
The relay I used requires a 5V supply, which can be sourced from the Arduino. However, to avoid overloading the Arduino, I opted to generate the 5V supply separately using a voltage regulator module from the main power supply, contrary to what is shown in the block diagram.
Figure: The circuit diagram for pulse shaping (the comparator section was also adapted from Burkhard Kainka’s article in the June 2011 issue of Elektor magazine, while the timer was sourced online).

Figure: Pulses after pulse shaping (grid 200 μs)

Components used:
- LCD: 1602 LCD module for Arduino, white on blue with backlight
- RTC: DS3231 AT24C32 IIC Real Time Clock Memory Module for Arduino
- SD Module: Micro SD TF Card Memory Shield Module SPI Reader for Arduino
The libraries are available through the Arduino reference, including example programs.
For operating the additional modules, I used the following pin assignments for the Arduino:
Pin configuration Arduino – LCD Display (4-bit version)
Arduino LCD-PIN Designation
Gnd. – 1 Vss
5V- 2 VDD
ext. Poti – 3 Contrast (0-5V)
D2- 4 RS; Register select
Gnd.- 5 RW; Read/Write
D3- 6 E; Enable
D4- 11 Data bit
D5 – 12 Data bit
D6 – 13 Data bit
D7 – 14 Data bit
5V – 15 LED Backlight Anode
Gnd. – 16 LED- Backlight Cathode
Pin configuration Arduino – SD Module
Arduino SD Module
D10 – CS slave select
D13 – SCK serial clock
D11 – MOSI master out slave in
D12 – MISO master in slave out
5V – Vcc
Gnd. – Gnd.
Pin configuration Arduino – RTC
Arduino RTC
A5 – SCL
A4 – SDA
5V – Vcc
Gnd. – Gnd.
However, the assignment of the components used should be reviewed once more.
It would certainly be advantageous to gradually build the entire signal processing setup on a breadboard first. In particular, the resistor combination at the input of the comparator may need to be adjusted to match the pulse amplitude at the amplifier’s output.
The use of the Arduino inputs/outputs can also be modified. In this case, the corresponding entries in the setup of the example sketch I plan to provide (at the end of the description for evaluating the measurement results) would need to be updated accordingly.
Structure of the Measurement Data File
The result of the pulse counting is saved on the SD card. The measurement data file is a plain text file and should ideally contain only one record per measurement point, consisting of the date/time and the number of pulses registered during the measurement period. However, an additional results column can be added for evaluating the measurement parameters EEC or PAEC for radon progeny. For this purpose, the calibration factor needs to be entered into the sketch. The determination of the calibration factor will be described later on the “Evaluation” page.
It is recommended to recalculate the measurement parameter from the pulse values after the measurement is completed using a spreadsheet program, as the exact calibration factor may need to be adjusted based on subsequent throughput measurements. However, using the calibration factor is beneficial for displaying an indicative value on the LCD screen during the measurement. The measurement of thoron progeny can only be performed offline using a spreadsheet program.
Date and time are read from the RTC module in the program sketch.
For this, the time on the module needs to be set first. I used a sketch from the Arduino Reference for this purpose.
Example of the Measurement Data File Structure:
Run. No. ; Date/Time; Pulses_Rn; EEC_Rn
0; ; ; Bq/m3
1 ; 7.6.2017 9:46 ; 35 ; 10
2 ; 7.6.2017 10:46 ; 70 ; 21
3 ;7.6.2017 11:46 ; 54 ; 16
4 ;7.6.2017 12:46 ; 57 ; 17
5 ;7.6.2017 13:46 ; 37 ; 11
Etc. …………..
Preliminary Measurement
After completing the assembly of the amplifier and data acquisition modules, the entire setup can be tested. As previously mentioned, it is important to verify that all pulses generated by the amplifier are registered by the Arduino. I suggest the following procedure:
- Expose a filter to decay products: To do this, draw air through a filter with a diameter of approximately 5 mm (see section “Air Intake”) using either the built-in pump or an external pump.
- Place the filter over the detector opening.
- Start data logging with the Arduino (output to an SD card or display via the serial monitor).
- Simultaneously count the pulses over a suitable time period (e.g., 1 minute) using an oscilloscope (preferably a storage oscilloscope).
- Compare the two counts.
Note: Minor deviations are possible since pulses can occasionally be missed; they do not occur uniformly due to the stochastic nature of radioactive decay. Therefore, it is recommended to repeat the test several times.
However, the test is easier if a material emitting alpha radiation is available.
The programs I used will be made available for download.
